Most teams trying to fix a slow site reach for the same generic checklist — compress images, minify CSS, add a CDN — apply all of it, and watch their Largest Contentful Paint barely move. The work wasn't wrong; it was aimed at the wrong place. LCP is one number with four very different causes underneath it, and fixing the wrong one is the most common reason "we optimized the site" produces no result.
The short version: don't optimize LCP, optimize the element that defines it, and within that element, optimize the phase that's slow. LCP breaks into four measurable sub-phases. One of them is almost always the bulk of your problem, and which one tells you exactly what to fix. This is a diagnostic method, not a checklist — and it's why two slow sites with identical LCP scores often need opposite fixes.
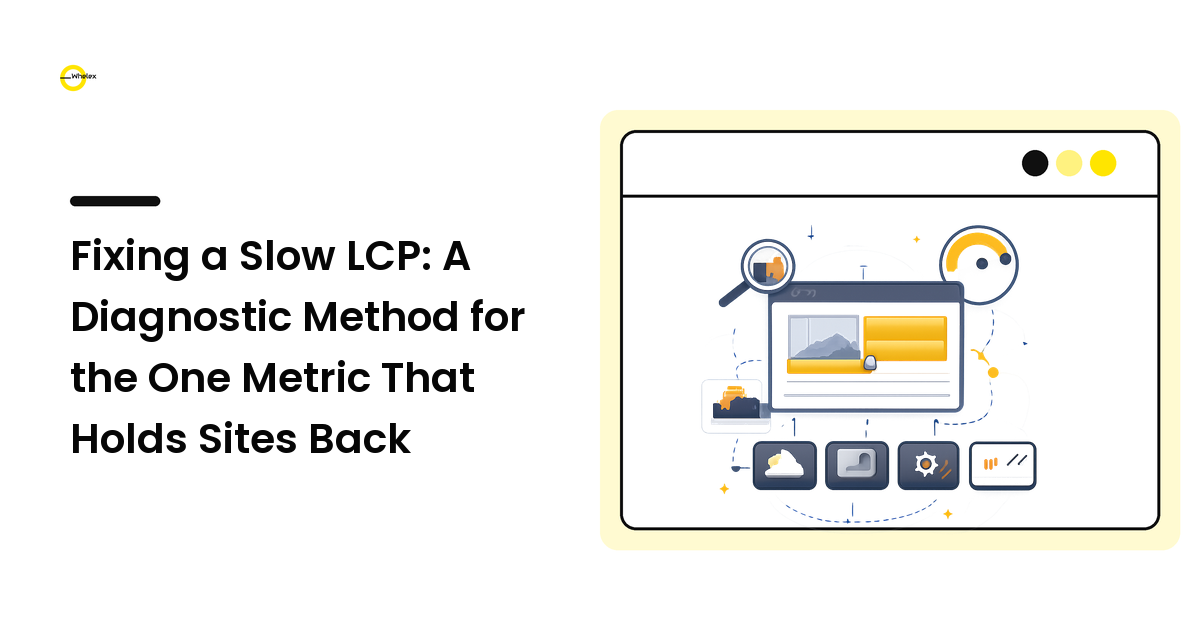
What LCP actually measures
Largest Contentful Paint is the time from when a page starts loading to when its single largest visible content element finishes rendering — usually a hero image, a heading block, or a large banner. Google treats it as a core signal of perceived load speed, and it's one of the Core Web Vitals that feeds into how a page is assessed. A "good" LCP is generally cited as under 2.5 seconds for most of your real visitors.
The trap is that LCP is one element's render time, not the whole page's. You can have a fast-feeling page with a slow LCP because one big image lags, or a sluggish page with a deceptively decent LCP. So step one is never "make the site faster" — it's "which element is my LCP, and why is it slow?"
This is the kind of work that quietly drives growth; for the wider picture of how performance ties into findability, see the performance and SEO guide. This article zooms all the way in on the single metric that most often blocks a good score.
Step 1: Find the real LCP element
You cannot fix what you haven't identified, and people's assumptions here are wrong more often than not. Use a lab tool (any modern performance profiler in your browser's dev tools, or a field-data report) to read out which element was the LCP for your page. Run it on the page that matters, on a throttled connection that resembles a real mobile visitor.
The surprise is common: a team is convinced their hero image is the culprit, profile it, and discover the LCP element is actually a block of below-the-hero text that renders late because a web font is blocking it. Optimizing the hero image would have done nothing. Identify the element first, every time.
Step 2: Break LCP into its four phases
This is the technique that separates a real diagnosis from guesswork. The time to render the LCP element splits into four consecutive phases:
- Time to First Byte (TTFB) — how long the server takes to start responding. Slow here points at hosting, backend, or redirects.
- Resource load delay — the gap between the page starting and the browser starting to fetch the LCP resource. Slow here means the resource is discovered late (e.g., hidden in CSS, lazy-loaded by mistake, or behind JavaScript).
- Resource load time — how long the LCP resource itself takes to download. Slow here means the file is too big or served without compression/right format.
- Element render delay — the gap between the resource finishing and the element actually painting. Slow here usually means render-blocking CSS or JavaScript is holding up paint.
Get the millisecond breakdown of these four for your LCP element. One of them is almost always the majority of your total. That is your problem. The other three are noise you can ignore for now.
A concrete worked example
A founder reports their landing page LCP is 4.1 seconds on mobile — well into "poor." The instinct on the team is "the hero image is too heavy, let's compress it." Before touching anything, they profile and break it down:
- TTFB: 0.5s
- Resource load delay: 2.4s
- Resource load time: 0.6s
- Element render delay: 0.6s
The hero image download is only 0.6 seconds — compressing it harder would save maybe 0.2s and leave them at 3.9s, still failing. The real villain is the 2.4-second load delay: the browser doesn't even start fetching the hero until late because it's referenced as a CSS background-image, which the browser only discovers after parsing the stylesheet. The fix is to make it a real <img> in the HTML with a fetchpriority="high" hint (or a <link rel="preload">), so the browser finds and fetches it immediately. That single change collapses the load delay to ~0.3s and brings LCP to roughly 2.0s — passing. The image was never the problem; when it was discovered was.
The mistakes — and why people make them
Optimizing the whole page instead of the LCP element. Generic speed checklists treat every byte equally. LCP doesn't — it's one element's timeline. People run the full checklist because it feels thorough, but it spreads effort across things that don't touch the metric.
Compressing images that were never the bottleneck. "Slow site → it's the images" is the reflex, and sometimes it's right. But as the example shows, the image download is frequently a small slice; the delay before fetching it, or render-blocking code after, is the real cost. The phase breakdown tells you which.
Lazy-loading the LCP image. A genuinely damaging one: teams apply loading="lazy" to every image as a best practice, including the hero. Lazy-loading deliberately delays discovery — exactly the wrong thing for the most important element. Never lazy-load the LCP element.
Trusting lab scores as field reality. A single lab run on a fast laptop can show a flattering LCP while real mobile visitors suffer. Always sanity-check against field data from actual users before declaring victory.
Edge cases and caveats
- Your LCP element can change. Different viewport sizes, A/B variants, or logged-in states can each have a different LCP element. Diagnose the version your real traffic sees.
- TTFB problems need backend fixes, not front-end ones. If load delay and TTFB dominate, no amount of image work helps — that's hosting, caching, or server code, a different team and a different budget.
- Some sites are render-delay bound. Heavy JavaScript frameworks can push paint late even when everything downloads fast. There the fix is reducing render-blocking JS, not touching images at all.
The one trick to remember
Stop asking "how do I make the page faster?" and start asking "what is my LCP element, and which of its four phases is slow?" Profile to find the element, get the four-phase breakdown, and fix only the dominant phase. A site that's load-delay bound and a site that's render-delay bound can show the same LCP score and need opposite fixes — the phase breakdown is the only thing that tells them apart. That's the difference between a week of effort that moves the number and a week that doesn't.
FAQ
What counts as a good LCP? Generally under 2.5 seconds for the bulk of your real (especially mobile) visitors, measured as the render time of the page's largest visible content element. Above about 4 seconds is considered poor.
Why didn't compressing my hero image improve LCP? Probably because image download wasn't your slow phase. If the bottleneck is the delay before the browser starts fetching the image, or render-blocking code after, a smaller file barely helps. Break LCP into its four phases to find the real cost.
Should I lazy-load images to improve performance? Lazy-load images below the fold, never the LCP element. Lazy-loading delays discovery, which is the opposite of what your most important above-the-fold element needs.
Is LCP the same as overall page speed? No. LCP is the render time of one specific element — the largest visible one. A page can feel fast while LCP is slow, or vice versa. Optimize the element that defines the metric, not the page in general.
Can hosting affect LCP? Yes. A slow Time to First Byte from your server or host directly inflates LCP and can't be fixed with front-end work. If TTFB dominates your phase breakdown, the fix is on the backend or hosting side.
Diagnosing performance properly — element first, phase second — is exactly the kind of work a good studio does before touching a line of code. If you'd like a team to find and fix what's actually slowing your site, talk to Whelex.